Figure 1.

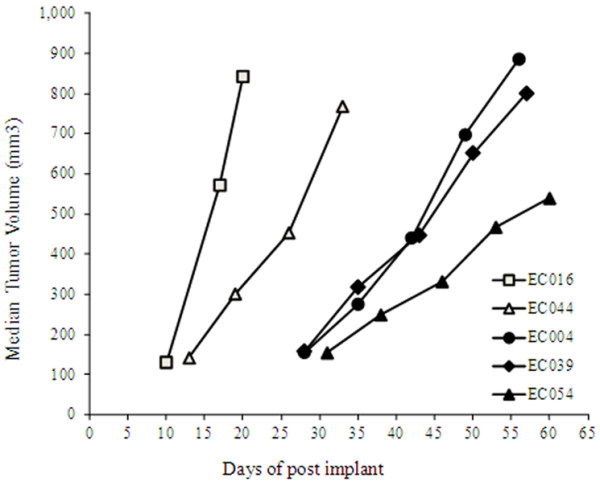
Tumor growth curves of the 5 PDECX mouse models at passage 3. Subcutaneous tumors were measured by caliper, and median tumor volumes in 3 tumor-bearing mice from each model are represented. X-axis represents days after tumor implantation.

Tumor growth curves of the 5 PDECX mouse models at passage 3. Subcutaneous tumors were measured by caliper, and median tumor volumes in 3 tumor-bearing mice from each model are represented. X-axis represents days after tumor implantation.