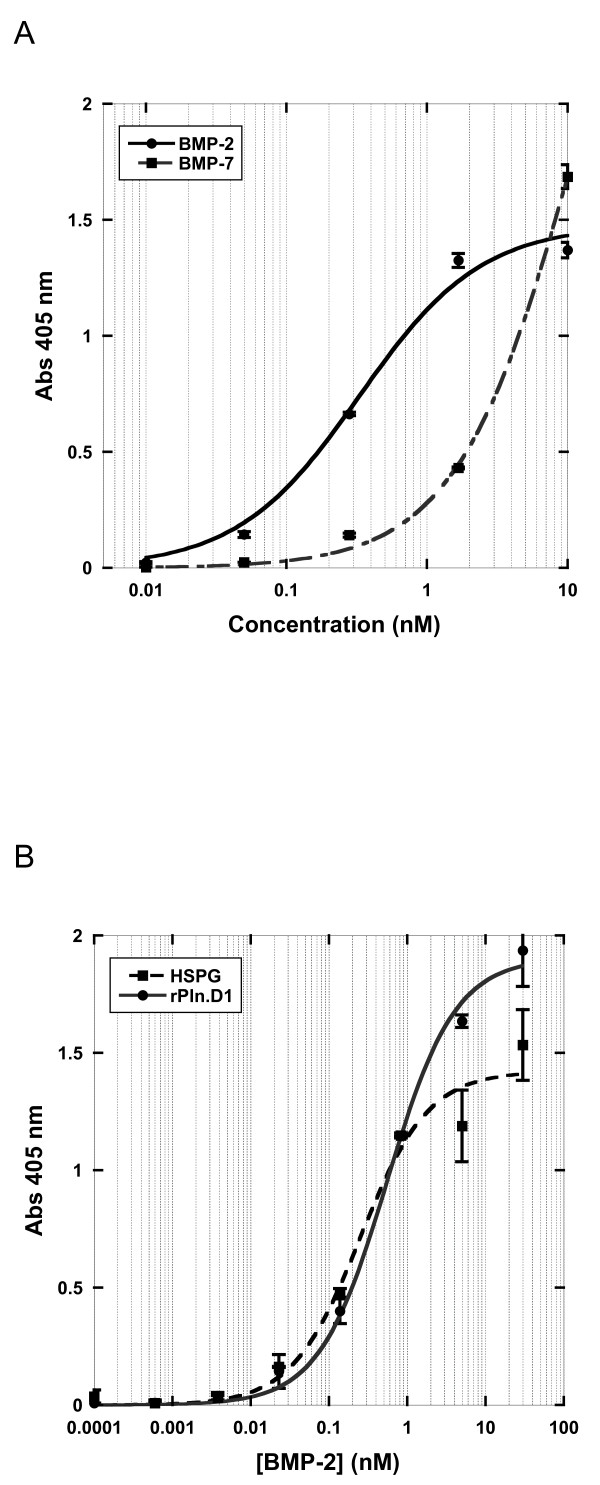
Figure 2.
Ligand Binding Curves; A: rBMP-2 (solid line) and rBMP-7 (dotted line) dilutions were bound in steady state to immobilized rhPln.D1. Retained BMP was detected by anti-BMP antibodies. Y-axis is Abs 405 nm; X-axis is rhBMP-2 and rhBMP-7 concentration in nM units. Equilibrium point (apparent Kd) is 0.4 nM for binding of rBMP-2 in this example. B: Either rhPln.D1 (circle, solid line) or a sample of HSPG (square, dashed line) were immobilized to bound CS-0071 anti Pln.D1 antibody then bound in steady state to dilutions of rBMP-2. Y-axis is Abs 405 nm; X-axis is rhPln.D1 and HSPG concenration in nM units. In this example, apparent Kd for BMP-2 binding with rhPln.D1 = 600 pM and for BMP-2 binding with HSPG = 150 pM after subtracting background. Error bars represent standard deviations of duplicates.

