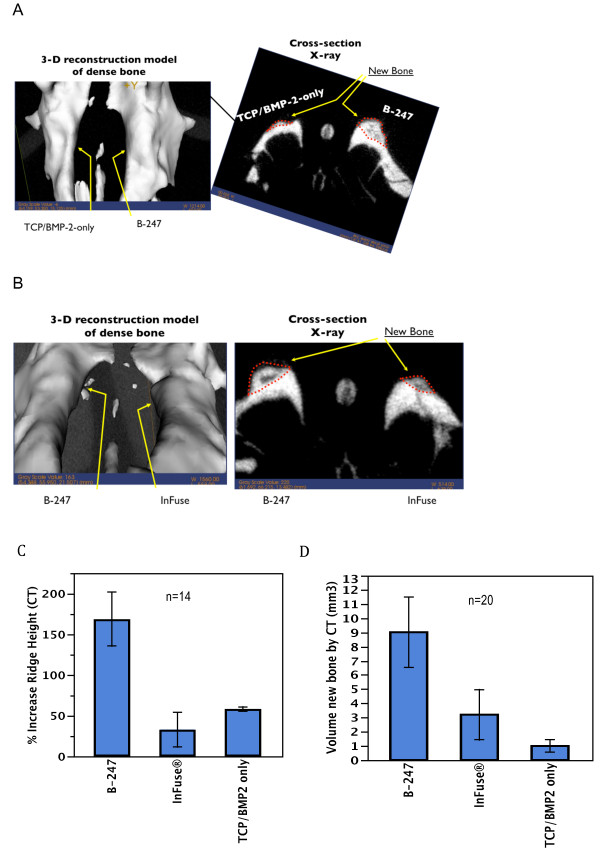
Figure 7.
A and B: μCT isosurface images (left) and cross-sectional radiographs (right) acquired after 12 weeks of healing using a 70kVp-25ma-20ms protocol and reconstructed at 52 microns resolution with a threshold of 600 voxel units. Dotted lines outline regions of new bone formation. A: Left ridge treatment - TCP loaded and lyophilized with 100 μg/ml of rhBMP-2. Right ridge treatment – B-247 treatment of TCP loaded and lyophilized with 100 μg/ml rhBMP-2 plus 100 μg/ml of pln.247 plasmid. B: Left ridge treatment – B-247 treatment of TCP loaded and lyophilized with 50 μg/ml rhBMP-2 plus 100 μg/ml of pln.247 plasmid. Right ridge treatment – InFuse™. C: Percent increase in maxillary ridge hight above normal (100%) after 6 to 12 weeks healing measured in μCT analysis for varying treatment conditions (n = 14). D: Volume of new bone assessed by μCT analysis for three treatment conditions after 6 to 12 weeks healing measured in μCT analysis (n = 20).

