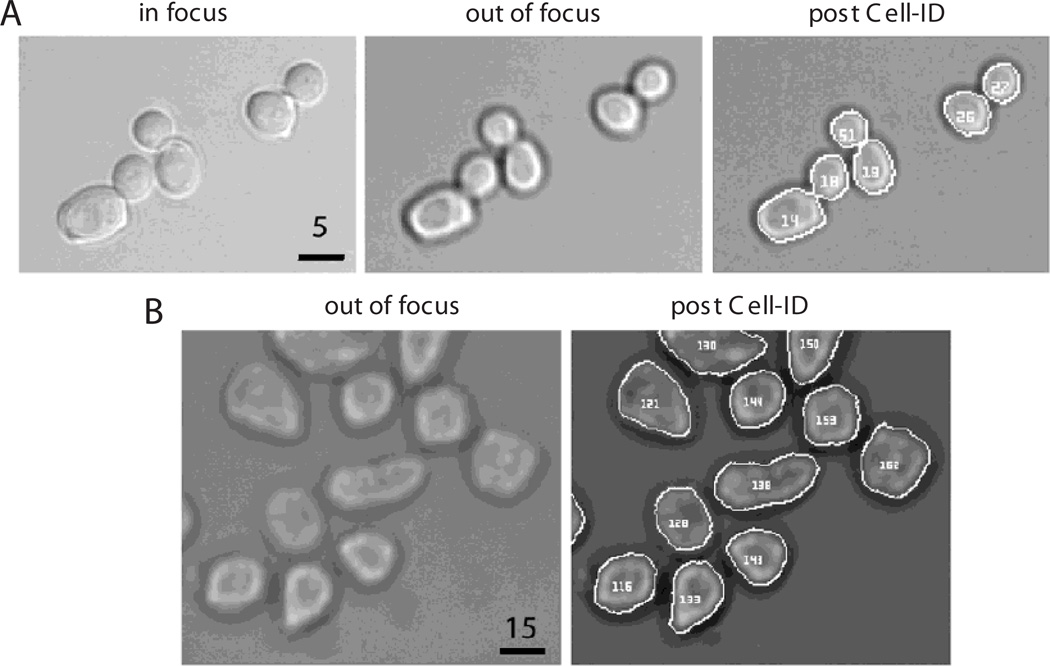
Figure 14.18.1.
Examples of yeast and mammalian cells processed by Cell-ID. (A) From left to right: yeast in focus, slightly defocused (note the dark ring on the border of the cells), and the same cells after Cell-ID has identified each one and traced their borders correctly. Bar = 5 µm. Magnification: 60×. (B) HEK293 cells fixed, trypsinized, and imaged (see Support Protocol 2 and the Basic Protocol), before (left) and after (right) Cell-ID has located them in the image. Bar = 15 µm. Magnification: 20×.

