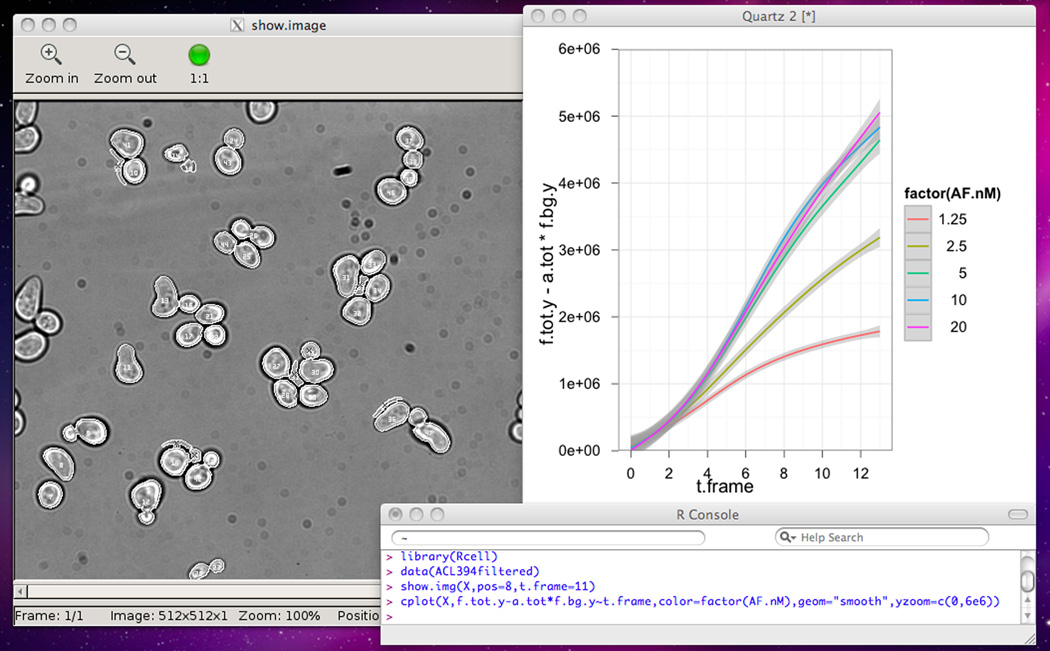
Figure 14.18.6.
Plotting with R. The upper left window contains an output of the show.img function. The upper right window shows a plot created with cplot. The bottom window shows the R console, with executed commands. For the color version of this figure go to http://www.currentprotocols.com.

