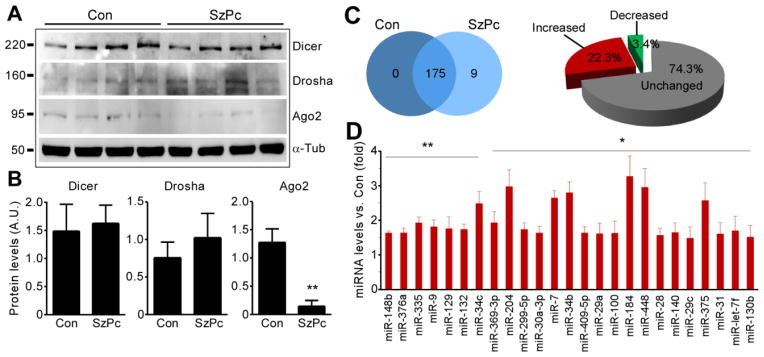
Figure 2. Modulation of miRNA expression following seizure preconditioning.
(A) Western blots (n = 1 per lane) showing Dicer, Drosha and Ago2 protein levels in CA3 in Con and 8 h following SzPc. (B) Semi-quantification of protein levels (p < 0.01 vs. Con; n = 4 per group). (C) Venn diagram and pie chart showing numbers of miRNAs expressed uniquely in Con and SzPc, those commonly expressed, and the increase or decrease as a percentage. (D) Graph showing expression data for individual miRNAs upregulated after SzPc (*p < 0.05; **p < 0.01; n = 4 per group).

