Figure 5.

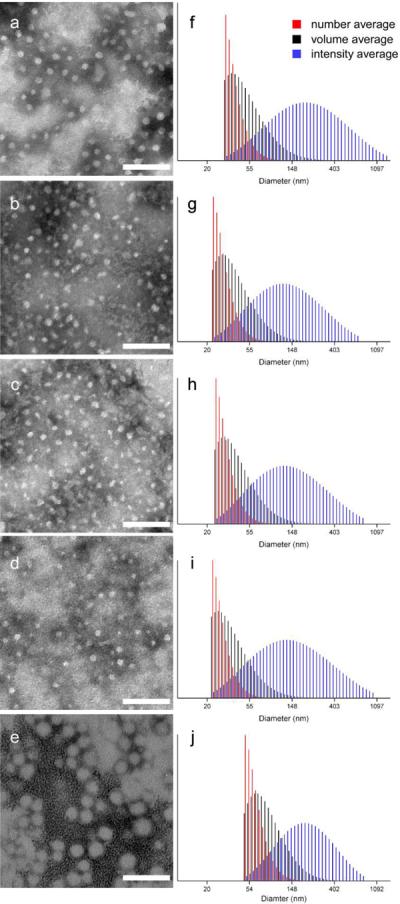
Left column: TEM images of (a) dSCK1; (b) dSCK2; (c) dSCK3; (d) dSCK4; (e) dSCK5. Right column: DLS histograms of (f) dSCK1; (g) dSCK2; (h) dSCK3, (i) dSCK4; (j) dSCK5. Scale bar = 100 nm.

Left column: TEM images of (a) dSCK1; (b) dSCK2; (c) dSCK3; (d) dSCK4; (e) dSCK5. Right column: DLS histograms of (f) dSCK1; (g) dSCK2; (h) dSCK3, (i) dSCK4; (j) dSCK5. Scale bar = 100 nm.