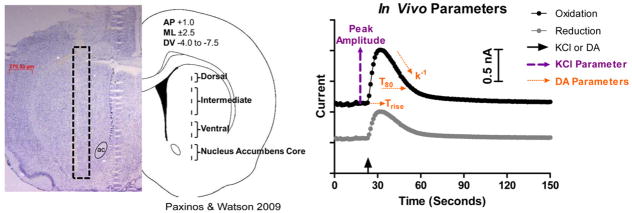
Figure 1.
Experimental methodology. A) Carbon fiber microelectrode placement within the rodent Str and NAc. The diagram on the right shows the approximate location of the tip of the carbon fiber microelectrode, and the left side shows the actual carbon fiber track (highlighted with the black box) from a 20 μm slice stained with cresyl violet. The carbon fiber microelectrode was lowered in 500 μm increments in both hemispheres (one hemisphere for KCl recordings and one for DA) and the average of these recordings was used to give one data point per sub-region. ac, anterior commissure. B) In Vivo Parameters. The arrow on the x axis indicates the time point of local application of KCl or DA. The KCl parameters used were the maximum amplitude of evoked DA release, represented by the purple dashed lines, and the ratio of the reduction/oxidation current (solid black line divided by the solid grey line). DA parameters included the time it took to clear 80% of the exogenous DA in reference to the maximum amplitude (T80), the curve fit based on first order fitting of the signal decay (k−1), and the amount of time it took to reach the peak amplitude (Trise), which are all represented by the orange dashed lines.

