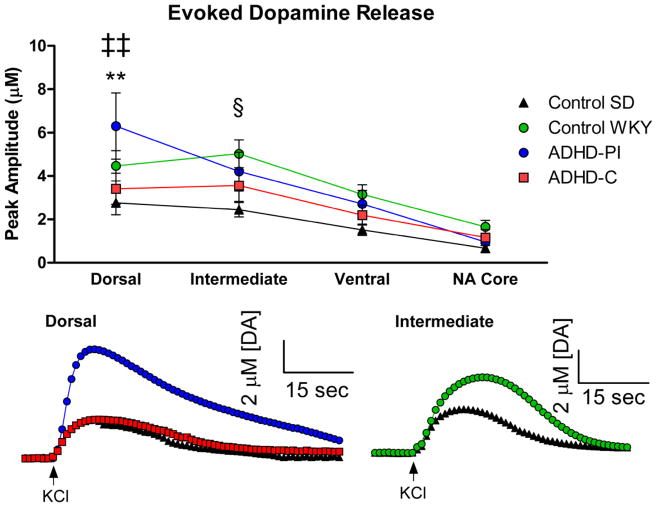
Figure 2.
Decreased KCl-evoked DA release in the SHR model of ADHD-C. A) The model of ADHD-C demonstrated significantly decreased KCl-evoked DA release versus the model of ADHD-PI in the dorsal Str (**p<0.01). The control SD also displayed decreased KCl-evoked DA versus the model of ADHD-PI in the dorsal Str (‡‡p<0.01). In the intermediate Str, it was observed that the control WKY displayed significantly increased KCl-evoked DA release versus the control SD strain (§p<0.05). Mean ± SEM. B) Representative tracing of the difference in KCl-evoked DA release in the dorsal Str between the model of ADHD-C, the model of ADHD-PI, and the control SD. C) Representative tracing of the difference in KCl-evoked DA release in the intermediate Str between the control SD and control WKY strains. Arrows indicate local application of KCl.

