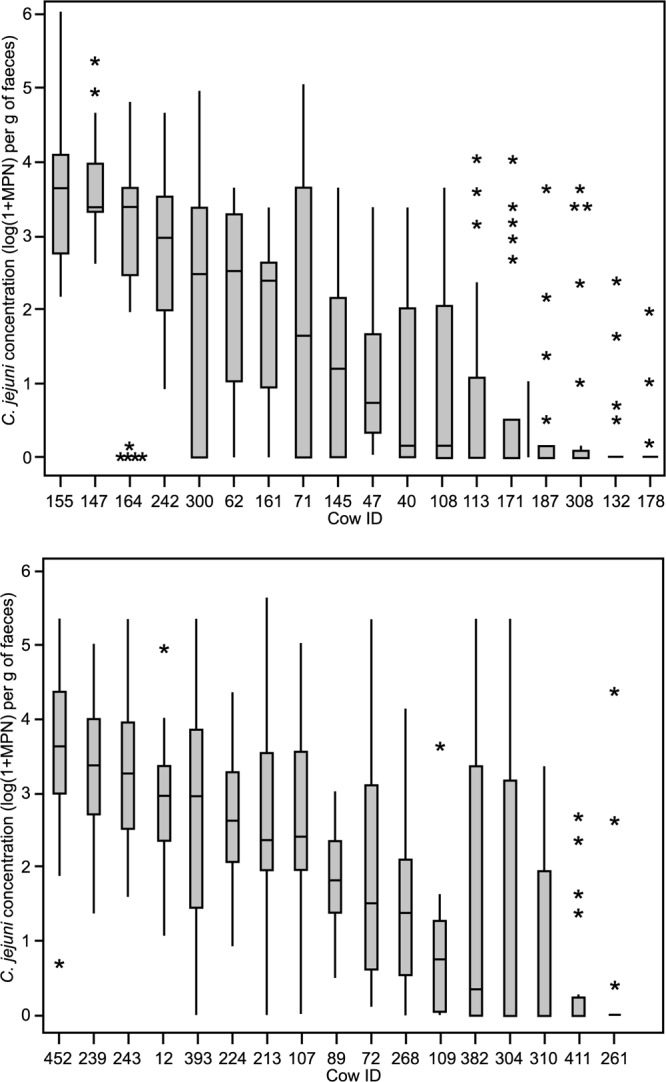
Fig 1.

Box plots showing the concentration of C. jejuni in the feces excreted by each cow during the 12 months of sampling on the pasture farm (top) and during the 10 months of sampling on the housing farm (bottom). The median is shown as the horizontal line inside each box; top and bottom edges of the box correspond to the 75th and 25th percentiles, respectively (i.e., each box shows the middle of 50% of the data). Whiskers show the maximum and minimum values (excluding outliers), while asterisks are outlier samples whose values are more than 1.5 times the difference between 3rd and 1st quartiles. n = 25 for each cow on the pasture farm, and n = 20 for each cow on the housing farm, except for cows 108 (n = 23), 304, 12 (n = 19), 62 (n = 16), 40 (n = 13), and 109 (n = 12).
