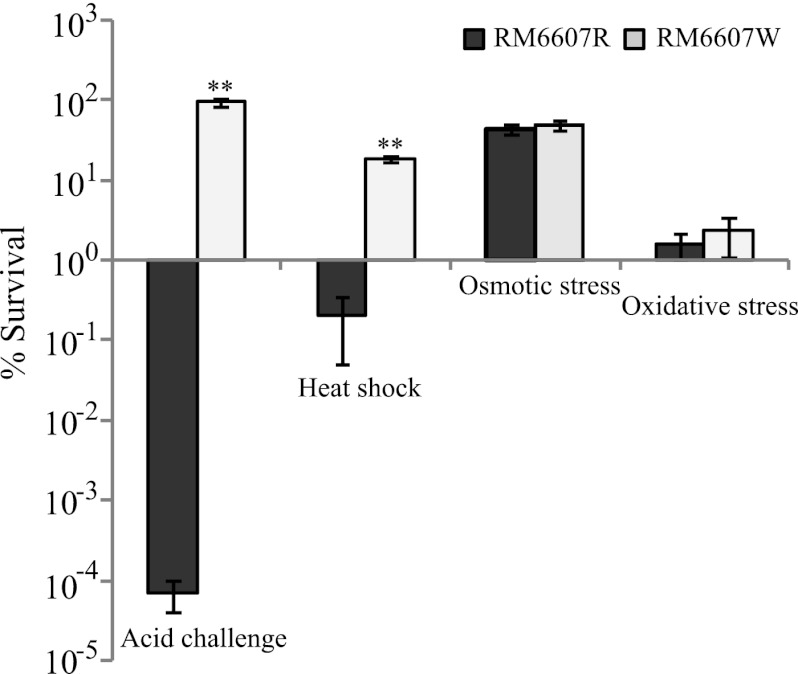
Fig 3.
Distinct stress fitness between E. coli O157:H7 group III curli variants. The percentages of curli variant cells that survived following various stress challenge are shown. The number of CFU following each stress challenge was compared with the corresponding CFU at the beginning of the stress challenge to calculate the percent survival. Significant differences in stress fitness (percent survival) between the curli variants RM6607R and RM6607W are indicated (**, P < 0.001 by t test).

