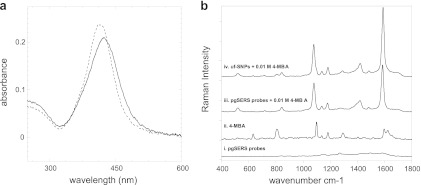
Fig 1.
(a) Comparison of UV/Vis absorption spectra of uf-SNPs (dashed line) and pgSERS probes (solid line). Spectra shown are averages of three measurements. (b) Raman spectra of (i) dried pgSERS probes, (ii) 4-MBA, (iii) 4-MBA enhanced by pgSERS probes, and (iv) 4-MBA enhanced by uf-SNPs. Each spectrum represents the average of 20 independently obtained spectra.

