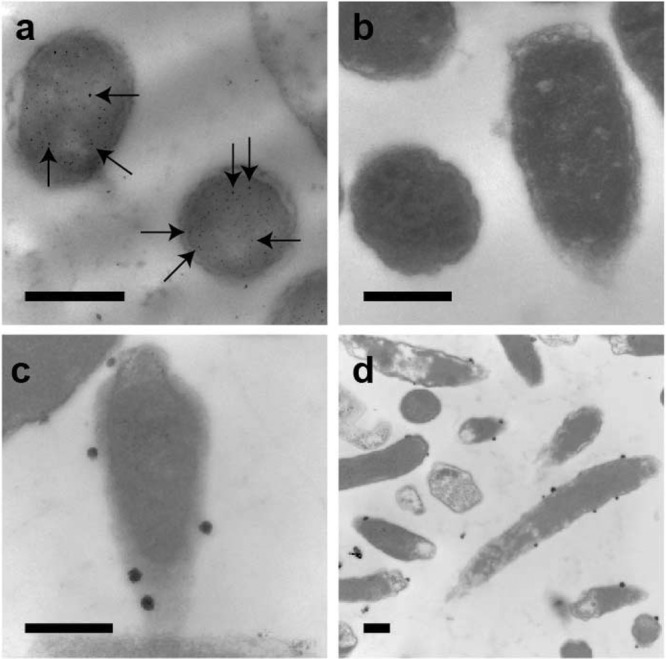
Fig 2.

Localization of uf-SNPs and pgSERS probes. Representative transmission electron microscopic images of ultrathin cross sections of E. coli DH5α cells fixed and embedded in LR White resin are shown. Dark spots are SNPs. (a) Cells mixed with uf-SNPs (uniform dispersion throughout the cell). (b) A control sample with no SNPs added. (c and d) Cells mixed with hydrophobic functionalized pgSERS probes (aggregation and localization at the hydrophobic cell membrane). Scale bars are 500 nm. The arrows in panel a point to several uf-SNPs. These were dispersed randomly throughout the cells.
