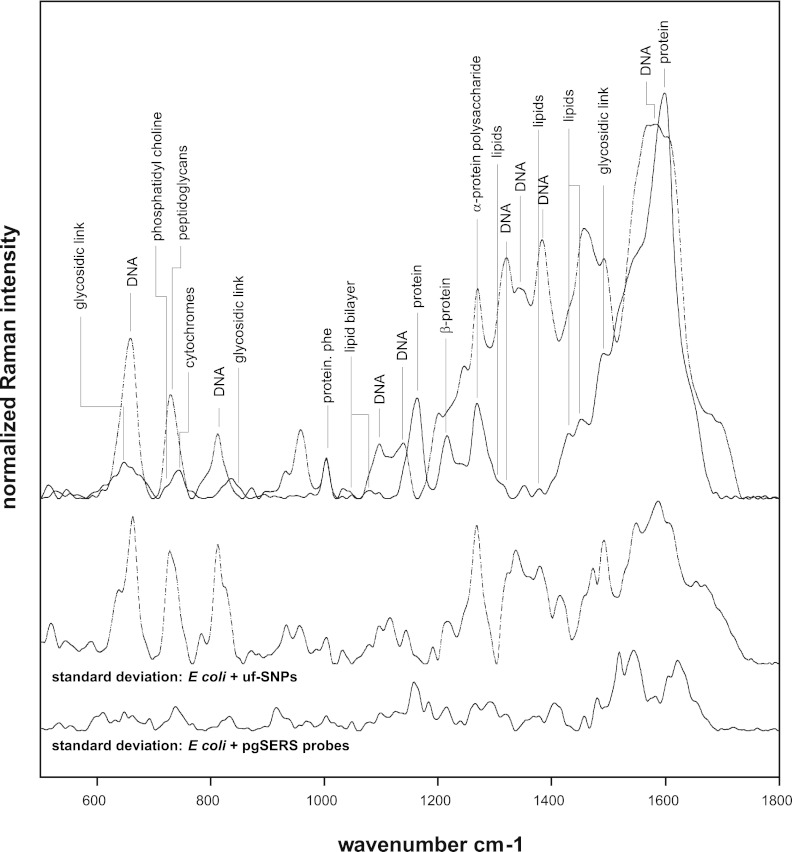
Fig 3.
Overlaid averaged (n = 10) SERS Raman spectra of E. coli DH5α cells (top) mixed with uf-SNPs (dashed line) and pgSERS probes (solid line). Peaks were assigned according to cited literature references. The corresponding standard deviation spectra are shown (bottom) for comparison. The pgSERS probes result in more reproducible Raman spectra.

