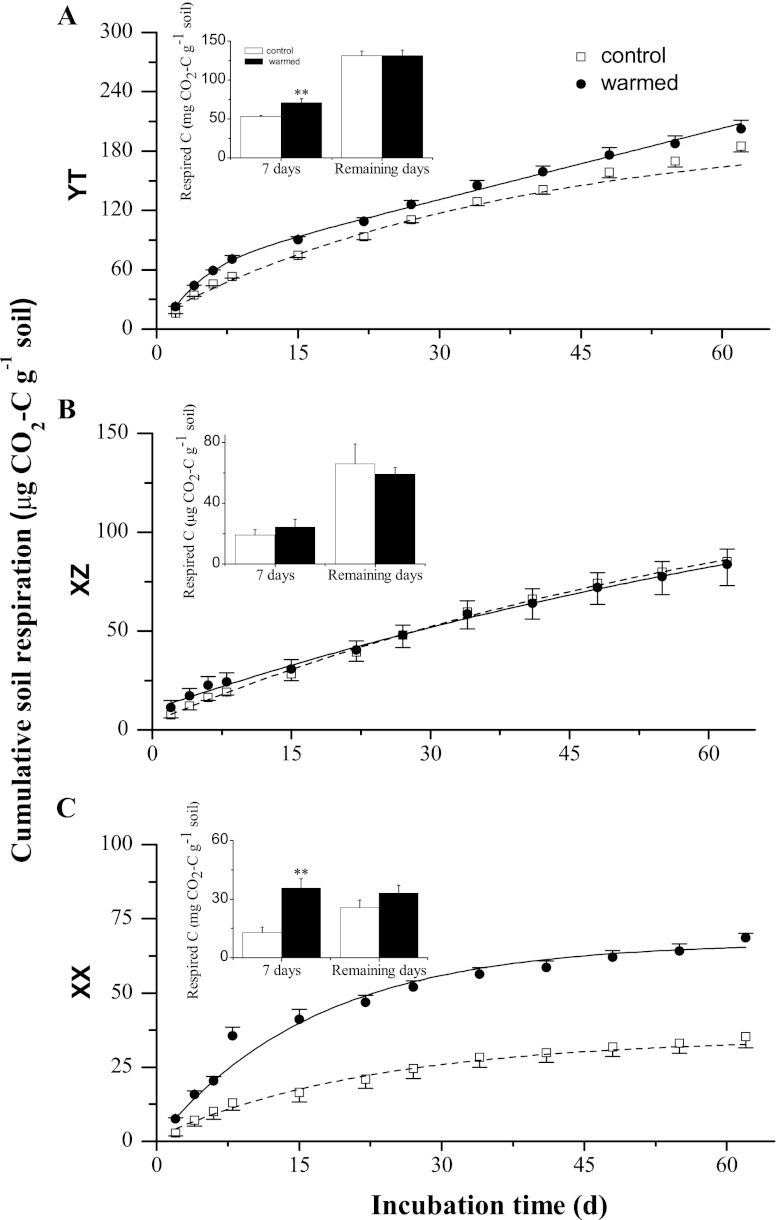
Fig 2.
Cumulative soil respiration (μg of CO2-C g−1 of soil) over the 60-day incubation period at a constant temperature of 25°C for the YT, XZ, and XX wetlands under control (dotted regression lines) and warmed (solid regression lines) conditions. Differences in cumulative soil respiration for the initial 7 days and the remaining days are shown in the inset bar chart. Error bars are +1 standard deviation. Asterisks represent significant Student's t test differences between warmed and control samples (*, P < 0.05; **, P < 0.01).

