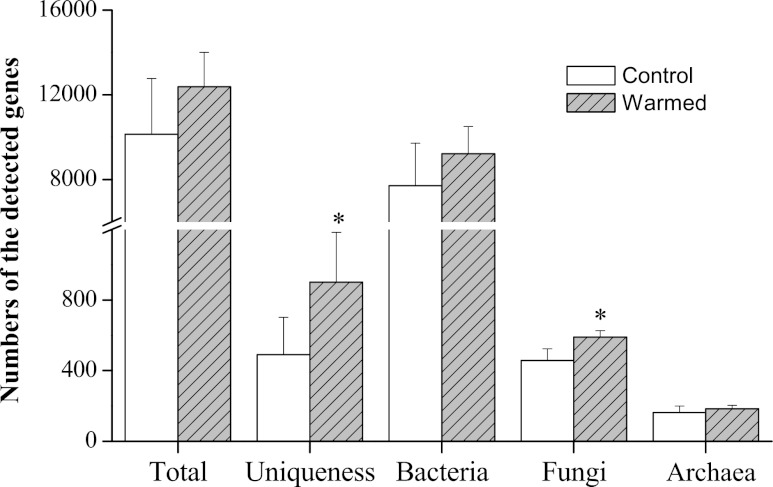
Fig 4.
Microbial community diversity of total detected genes (total), unique genes detected only in control or warmed samples (uniqueness), and main phylogenetic groups (bacteria, fungi, and archaea), as indicated by detected gene numbers under warmed and control conditions (control, ambient temperature; warmed, ambient temperature + 5°C) by GeoChip 4.0. The number of genes in each category is the average of total gene numbers from YT, XZ, and XX wetland samples. Error bars are +1 standard deviation. Asterisks represent significant Student's t test differences between warmed and control samples (*, P < 0.05; **, P < 0.01).

