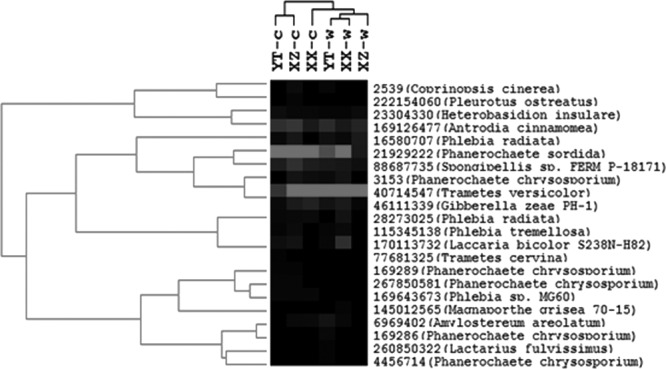
Fig 7.

Hierarchical cluster analysis of mnp genes encoding manganese peroxidase, which is responsible for lignin degradation. Results were generated in CLUSTER, version 3.0, using the Spearman rank correlation and the complete linkage method and visualized using TREEVIEW. Gray indicates signal intensities above background while black indicates signal intensities below background. Lighter gray indicates higher signal intensity. YT-c, XZ-c, and XX-c represent control samples, and YT-w, XZ-w, and XX-w represent warmed samples. Warmed samples clustered together and were well separated from the controls. Protein identification numbers and organisms are given at right.
