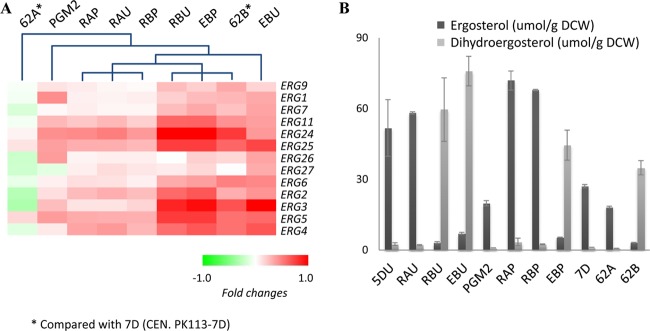
Fig 4.
Changes in ergosterol metabolism in the reconstructed strains illustrated as fold changes in gene transcription and the concentrations of ergosterol and dihydroergosterol compared to the other strains. (A) Hierarchical clustering of all strains is computed using fold changes of genes in ergosterol metabolism. (B) Concentrations of ergosterol and dihydroergosterol. Error bars represent the standard deviations from biological duplicates.

