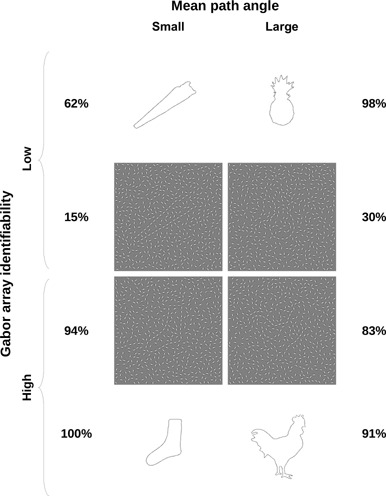
Figure 2.

Example and counterexample stimuli for the trend towards lower identifiability for stimuli with extreme mean path angles. Identification rates for outlines are taken from Wagemans et al (2008). Identification rates shown for Gabor arrays are averaged across all Gabor versions (RCR version depicted here). The sharply curved handle of number 196 ‘saw’ (top left) illustrates how diagnostic small-scale detail is lost in the Gabor arrays, leading to matching difficulties. Number 211 ‘sock’ (bottom left) shows how larger-scale diagnostic information such as longer, smoother curves can be well preserved. The jagged top of number 173 ‘pineapple’ (top right) is difficult to group accurately in Gabor arrays, while the remainder of the shape offers little diagnostic information. Smooth segments in number 191 ‘rooster’ (bottom right), however, and the configural relations between them, are diagnostic and appear to compensate for potential grouping difficulties in the tail or head and neck areas, illustrating the importance of global shape properties.
