Figure 14.

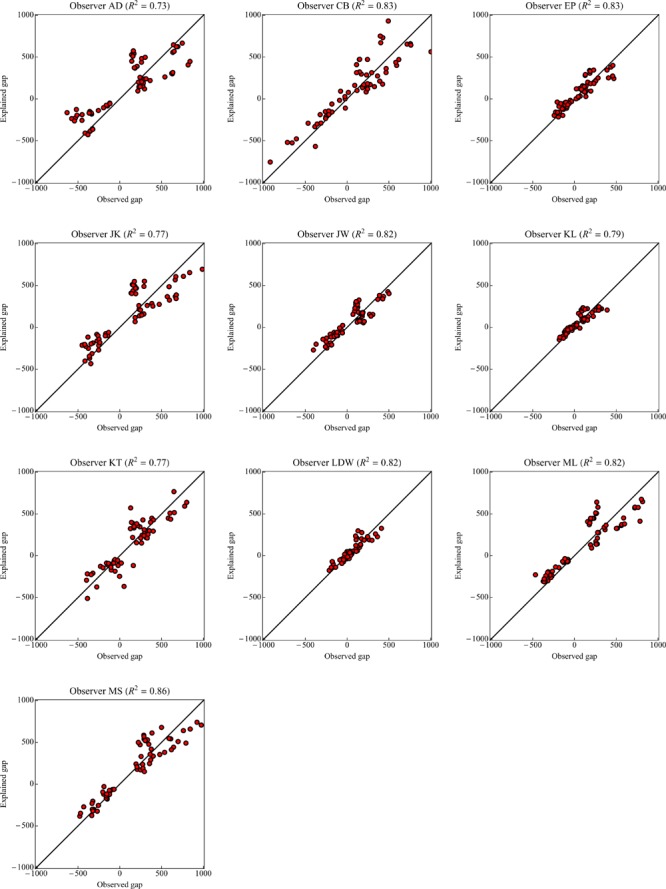
Scatter plots of the explained depth gaps against the observed depth gaps for all observers. Note that the correlations are quite high (coefficients of variation 0.73–0.86).

Scatter plots of the explained depth gaps against the observed depth gaps for all observers. Note that the correlations are quite high (coefficients of variation 0.73–0.86).