
Figure 19.
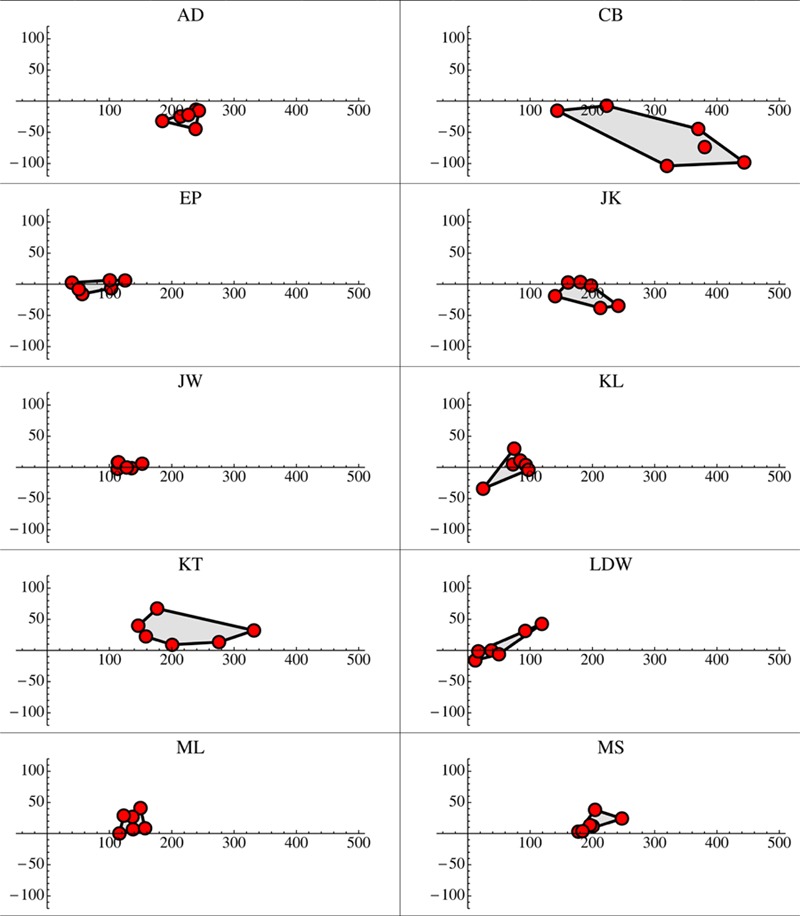
Projections on the plane spanned by the principal components for all ten observers. The first component is horizontal, the second vertical, in these plots. The red dots indicate the individual sessions, the gray polygonal areas their convex hulls in the plane. Apparently, the first component dominates the responses, indicating that all observers ‘see the same shape’, at least qualitatively.