
Figure 26.
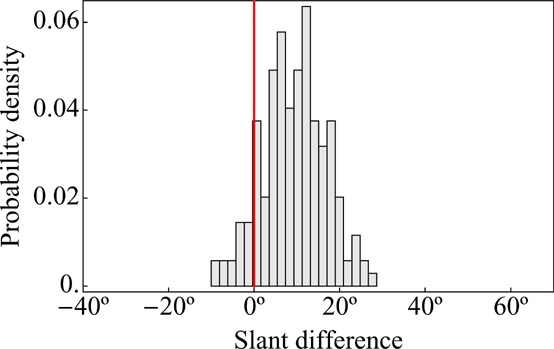
Histogram of the differences of absolute values of near-to-far and far-to-near slants (compare with figure 7b, which is based on a much larger group of observers). The same type of deviations are encountered in both cases. This plot shows pooled data of observers AD, JK, and JW.