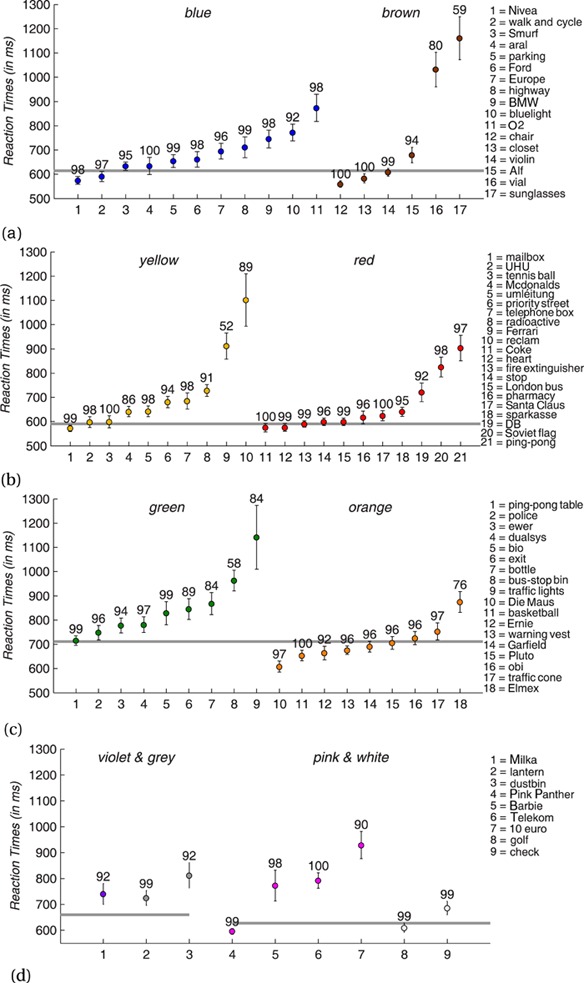
Figure 2.

Reaction times and accuracy rates for candidate objects. The different parts of the figure correspond to the category pairings (cf table 2). The x-axis lists the artificial objects of each category in the order of their average reactions times. The y-axis represents reaction times in ms for correct responses. Coloured disks show reaction times averaged over thirty-one participants; the respective error bars depict standard errors of mean. The grey line corresponds to the median reaction time of the whole category pair, that is, including the natural objects. Category pairs are: (a) blue–brown, (b) yellow–red, (c) green–orange, and (d) violet–grey and pink–white.
