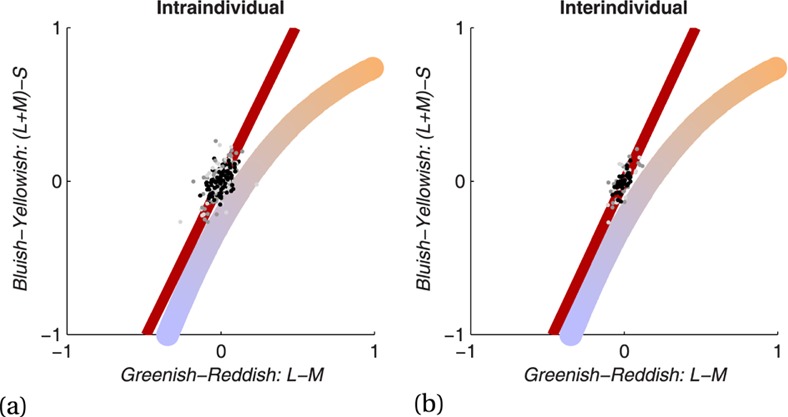
Figure 6.

Variability of achromatic adjustments for control stimuli. The dots represent the single adjustments of four control stimuli: The two kinds of disks (black dots), the golf ball (light grey), and the colour-neutral sock (dark grey). The red curve is the principal component that represents the main common variation of x and y values. In order to illustrate daylight variation, the correlated colour temperature is shown as a curve that is coloured according to the actual hues that correspond to the coordinates. (a) Intraindividual variability: the coloured dots depict the single adjustments for all participants after subtraction of the respective participant's mean. (b) Interindividual variability: the coloured dots show the average adjustments for each object and each participant.
