Figure 2.

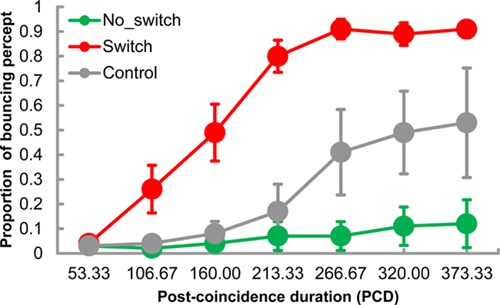
Mean proportion of bouncing percept for each condition tested in Experiment 1. The green, red, and grey circles correspond to the no-switch, switch, and control conditions, respectively. Error bars denote standard errors of mean (n = 5).

Mean proportion of bouncing percept for each condition tested in Experiment 1. The green, red, and grey circles correspond to the no-switch, switch, and control conditions, respectively. Error bars denote standard errors of mean (n = 5).