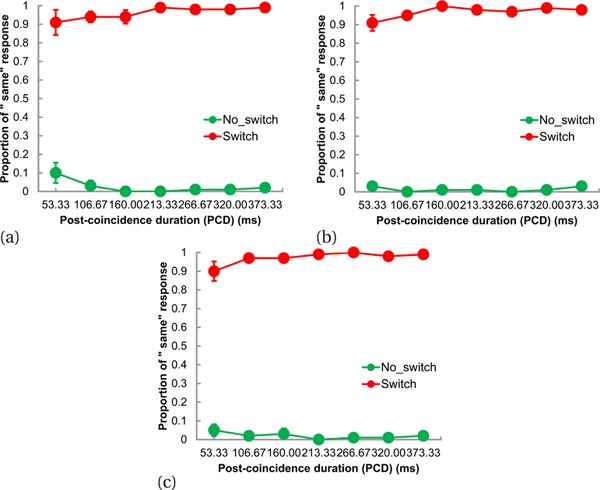
Figure 6.

Mean proportion of the “same” response for each condition tested in (a) Experiment 4a, (b) Experiment 4b, and (c) Experiment 4c. The green and red circles correspond to the no-switch and switch conditions, respectively. Error bars denote standard errors of mean (n = 5).
