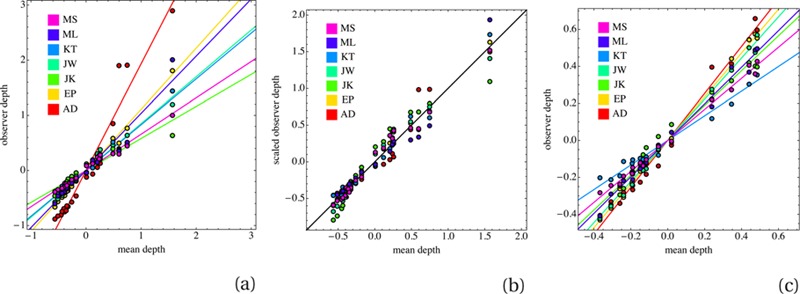
Figure 10.

(a) A scatter plot of the means of the three sessions of all observers, based on all data. Depths of each observer are plotted against the mean over all observers and all sessions. The regression lines for the observers are clearly distinct. (b) A scatterplot containing the same data, but after applying affine transformations that align the regression lines. This removes the idiosyncratic scalings. (c) A scatter plot of the near field data alone. These are the same data as in the left plot, but because the far range data are removed, the means are of course different.
