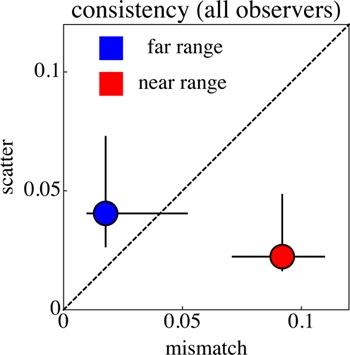
Figure 12.

The standard deviation in the “mismatches” versus the “scatter,” which is the standard deviation in the depth differences from the three repeated sessions divided by the square root of N−1 for all observers. The lines show the total range, the dots the median values. The data have been split into the near and the far ranges.
