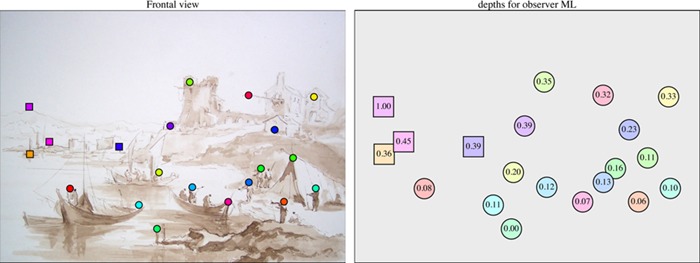
Figure 7.

At left the stimulus picture with the 20 fiducial locations indicated. The points indicated with square marks are in the far range. The points are labeled by hue. At right the depths from one session of observer ML. In protect Figure 8 the same data are represented in three-dimensional pictorial space. Again, the points are labeled by hue. For the sake of concise rendering the numerical values have been normalized on the range of zero to one, and coarse-grained to two significant figures.
