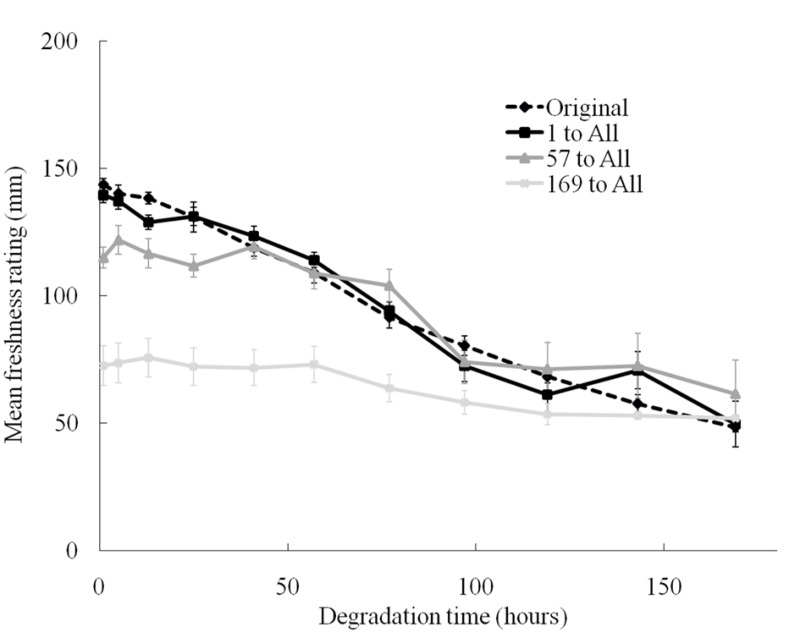
Figure 6.
Results for perceived freshness versus time for the artificial images. Mean values (N = 30) are plotted, and the error bars represent the standard error values. The black broken line represents the results of Experiment 1. The black, dark grey, and light grey solid lines represent the results for the “1 to All”, “57 to All”, and “169 to All” artificial stimulus groups, respectively.

