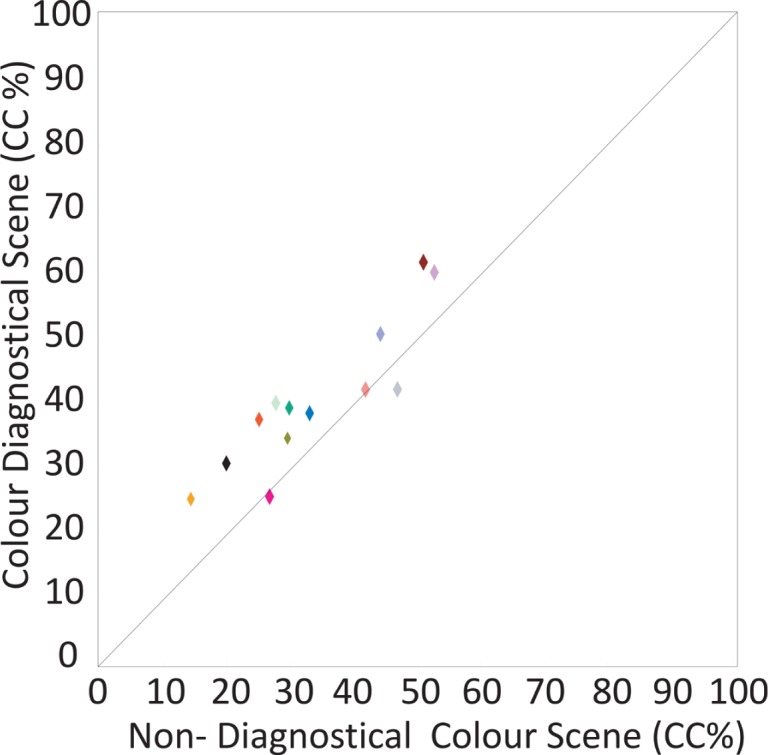
Figure 13.

Results of Experiment 4. Shown are the average colour constancy indices (in %) for each individual subject (represented as a symbol), plotted for the colour diagnostical scene (y-axis) and the non-diagnostical colour scene (x-axis). Ten of the thirteen symbols are above the unity line indicating that on average subjects obtained better colour constancy when tested in the colour diagnostical scene compared to when measured in the non-diagnostical colour scene.
