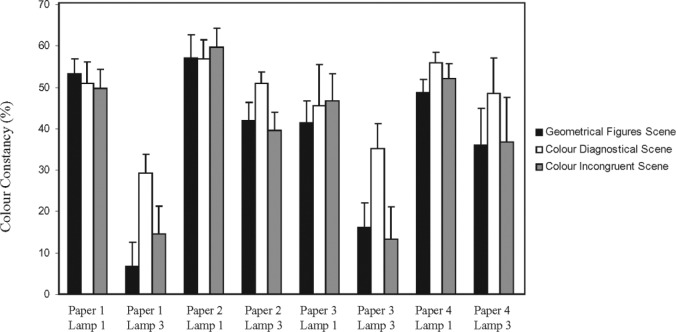
Figure 6.
Results of Experiment1. Shown are the colour constancy indices (in percentages with their SE) for each combination of Munsell paper and lamp. Results for the geometrical figures scene (black bars), colour diagnostical scene (white bars), and those for the colour incongruent scene (grey bars) are separately plotted. Note the distinct advantage in colour constancy for the colour diagnostical scene when the scenes are illuminated by lamp 3.

