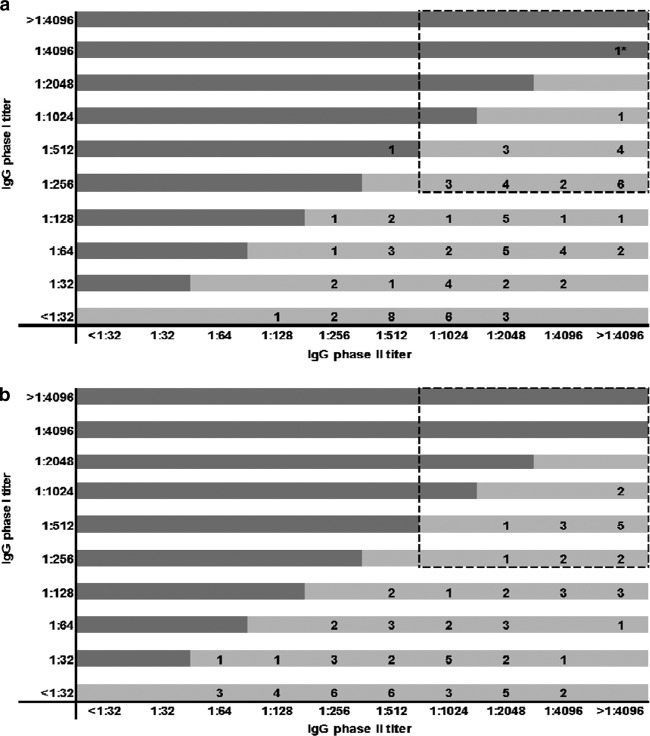
Fig 1.
Distribution of IgG phase I and phase II antibody titers as determined by immunofluorescence assay at 12-month follow-up in acute Q fever patients. (a) Early-diagnosed group (negative ELISA IgM phase II and positive PCR), n = 84 samples; (b) late-diagnosed group (positive or dubious ELISA IgM phase II confirmed by positive IFA (IgG phase II and/or IgM phase II titers of ≥1:32), n = 82 samples. The dashed box indicates high antibody titers. *, Patient with proven chronic Q fever infection.

