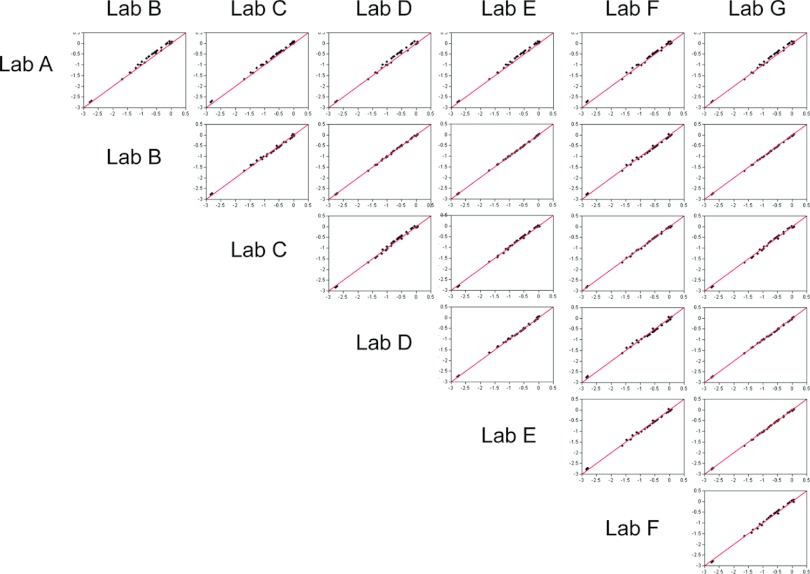
Fig 3.
Scatter plots of pairwise comparisons of RP values derived from ANOVA models, adjusting for laboratory (A to G), antigen, and lysate preparation temperature, from the replicate RPs submitted for analysis. The data are combined over antigens and plotted on a log10 scale. Predicted RPs were derived from ANOVA random-effects models. The number of strains in common between any two laboratories is listed in Table 2. The solid line indicates perfect agreement (intercept = 0, slope = 1).

