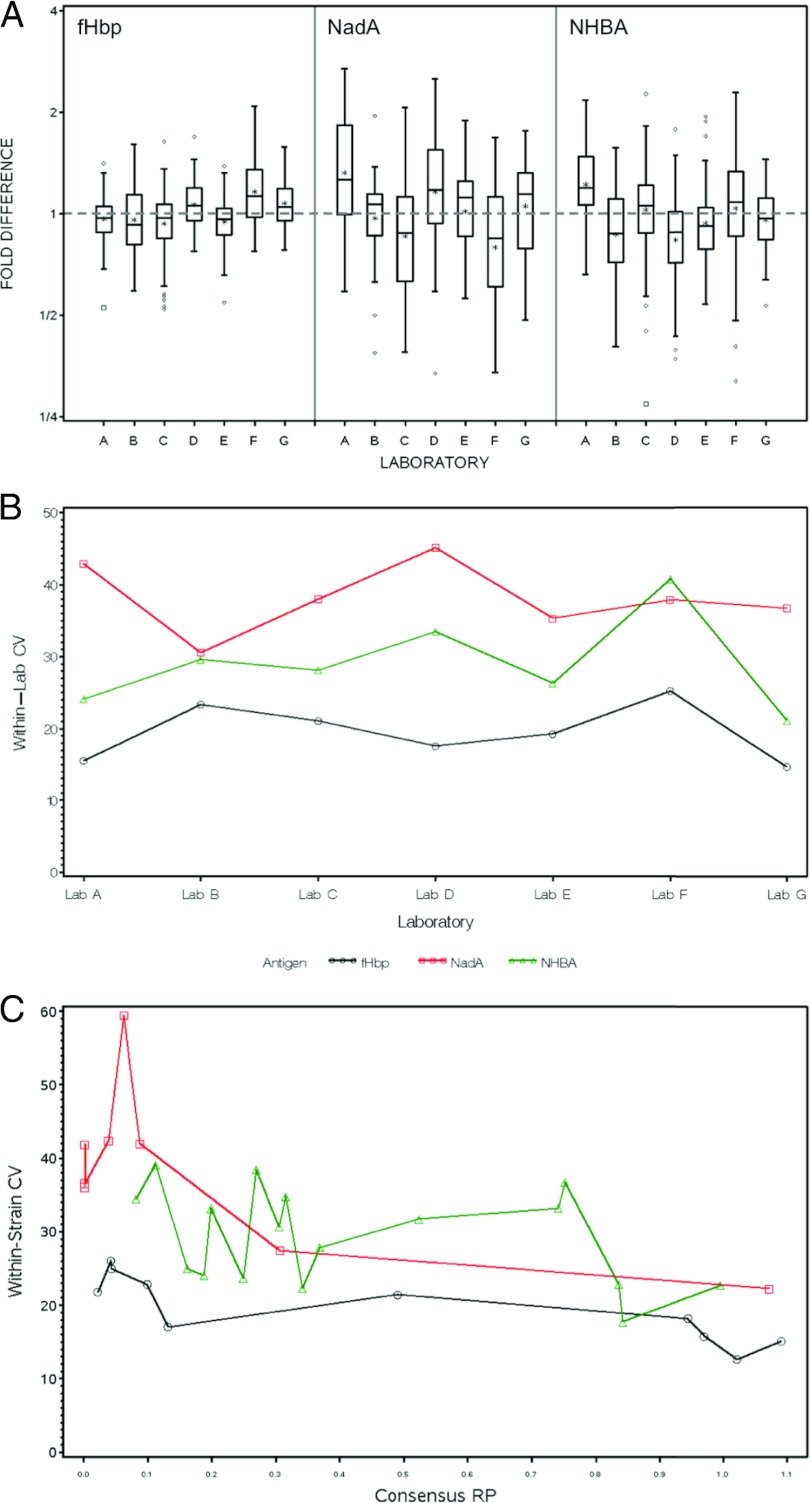
Fig 4.
(A) Box plots by antigen and laboratory (A to G) for the fold difference between the consensus and observed RPs. Consensus RPs were estimated for each strain and antigen using a random-effects ANOVA model. The box is defined by the 25th and 75th percentiles of the distribution; the horizontal line in the box represents the median (50th percentile) and the asterisks (*) signify the means. Vertical lines extend to the most extreme observation that is <1.5 × the interquartile distance (75th to 25th percentiles). Diamonds and small boxes (♢, □) correspond to moderate and severe outlying assay values, respectively. Each box represents the distribution of all replicate data for all strains within a laboratory and antigen. (B) Plots of within-laboratory CVs by antigen derived using random-effects ANOVA models. (C) Plots of within-strain CVs by antigen using random-effects ANOVA models. For fHbp, NadA, and NHBA, the strains are plotted on the x axis using consensus RPs derived from ANOVA models.

