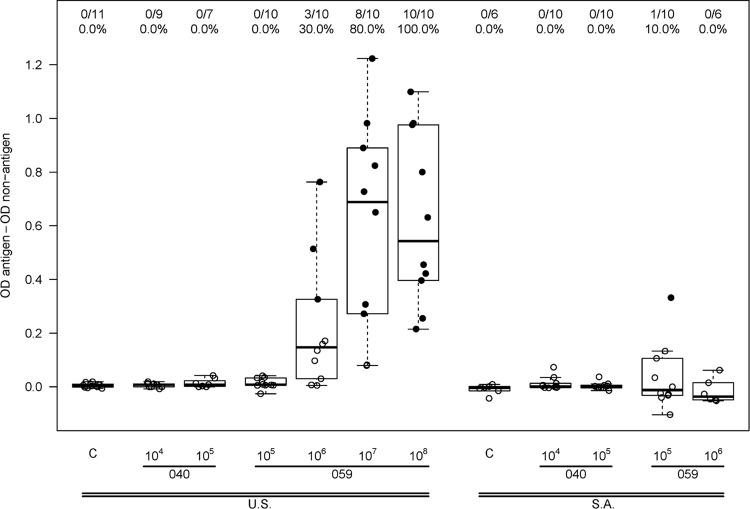
Fig 3.
ELISA responses 2 weeks after 3rd vaccination (day 98). A solid dot represents a positive response, and an open dot is for a negative response. Numbers at the top show the number of responders/number of assay results and the percentage with a positive result. For each box plot, 25% of the data points lie below the box and 25% lie above the box, and the horizontal line inside the box is the median. The vertical lines (whiskers) above and below the box extend to the most extreme data point, which is no more than 1.5 times the height of the box.

