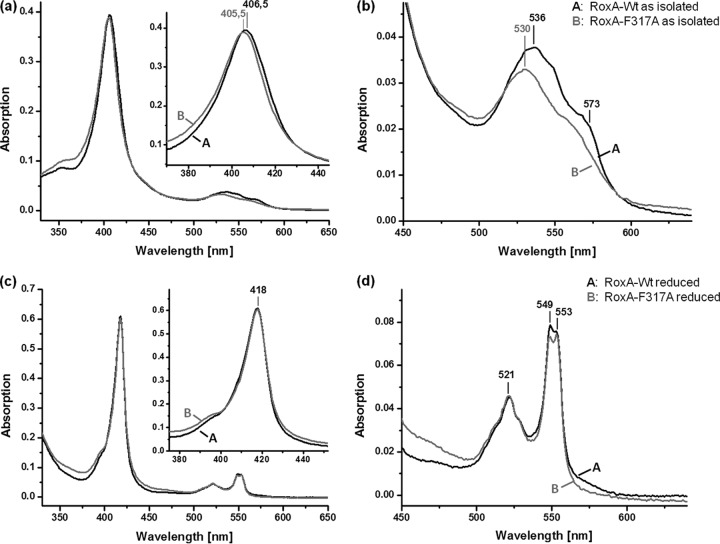
Fig 3.
UV-vis spectra of WT-RoxA and RoxA-F317A. (a and b) Spectra of recombinant WT-RoxA and RoxA-Phe317Ala, as isolated (2 μM). The Soret-band region is enlarged in the inset of panel a; panel b shows the Q-band region from panel a. The Phe317Ala mutein had a 1-nm blue-shifted Soret maximum and less pronounced Q bands, with a blue-shifted maximum at 530 nm. (c and d) Spectra of recombinant WT-RoxA and RoxA-Phe317Ala, both reduced with Na+-dithionite under an N2 gas atmosphere. In panel c, the Soret-band region is enlarged in the inset; panel d shows the Q-band region from panel c. WT-RoxA and the Phe317Ala mutein both had a Soret band at 418 nm and exhibited only minor differences in intensity for the α-bands, which were of almost equal intensities. The 549-nm α-band appears to be slightly more intense than the 553-nm band in the WT spectrum and appears to be less intense in the Phe317Ala spectrum.

