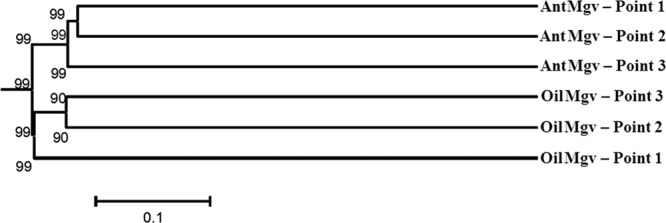
Fig 4.

Dendrogram based on nifH gene clone libraries showing the differences in community structure at six sampling points. The distance matrices were generated with UNIFRAC and were used to group the points of the sediments analyzed using the unweighted-pair group method with arithmetic means, and jack-knife analysis was used to evaluate the robustness of each cluster related to the environment, size, and uniformity of the sample. The numbers indicate the frequency in the permutation test, which was supported by jack-knife analysis.
