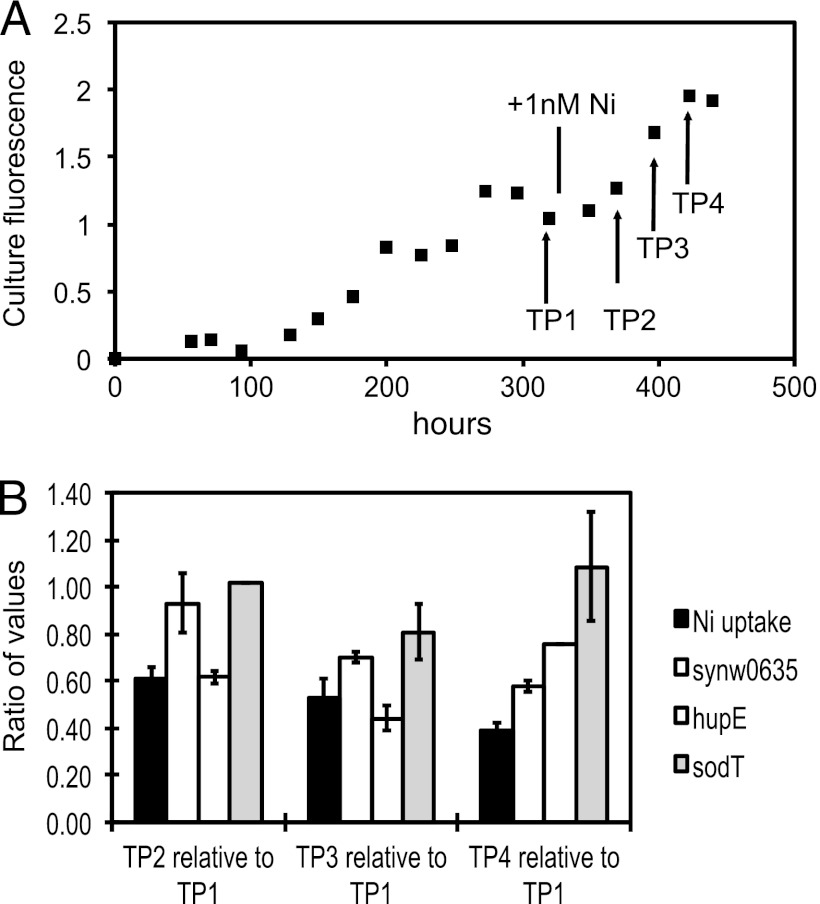
Fig 3.
Time course of Ni limitation and putative Ni transporter expression. (A) The top panel shows the culture fluorescence of a culture of WH8102 grown on NH4+ without added Ni until limitation (TP1). At this point, Ni was added, resulting in a return to exponential growth. Culture fluorescence is in arbitrary units. (B) Ni uptake rates and the expression of the indicated genes were determined at the indicated time points. Ratios of each time point with the initial Ni-limited values are shown. Ranges are for duplicate cultures.

