
Fig 2.
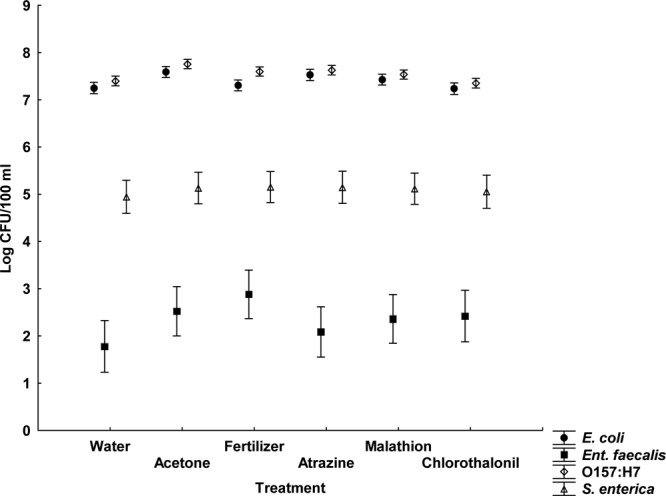
Average bacterial concentrations for all agrochemical treatments in the water column of the light microcosms (least-squares means ± the SE; n = 4). This figure shows data from a repeated-measures analysis.
Official websites use .gov
A
.gov website belongs to an official
government organization in the United States.
Secure .gov websites use HTTPS
A lock (
) or https:// means you've safely
connected to the .gov website. Share sensitive
information only on official, secure websites.
Average bacterial concentrations for all agrochemical treatments in the water column of the light microcosms (least-squares means ± the SE; n = 4). This figure shows data from a repeated-measures analysis.