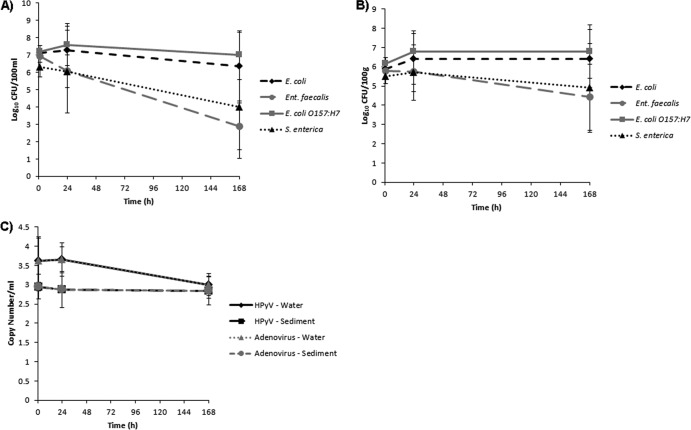
Fig 3.
Concentrations of target microbes in the dark microcosms, averaged for all agrochemical treatments (± the standard deviation [SD]). (A) Culturable concentrations of target bacteria in the water column. (B) Culturable concentrations of target bacteria in the sediments. (C) Concentrations of viruses in both matrices measured by qPCR.

