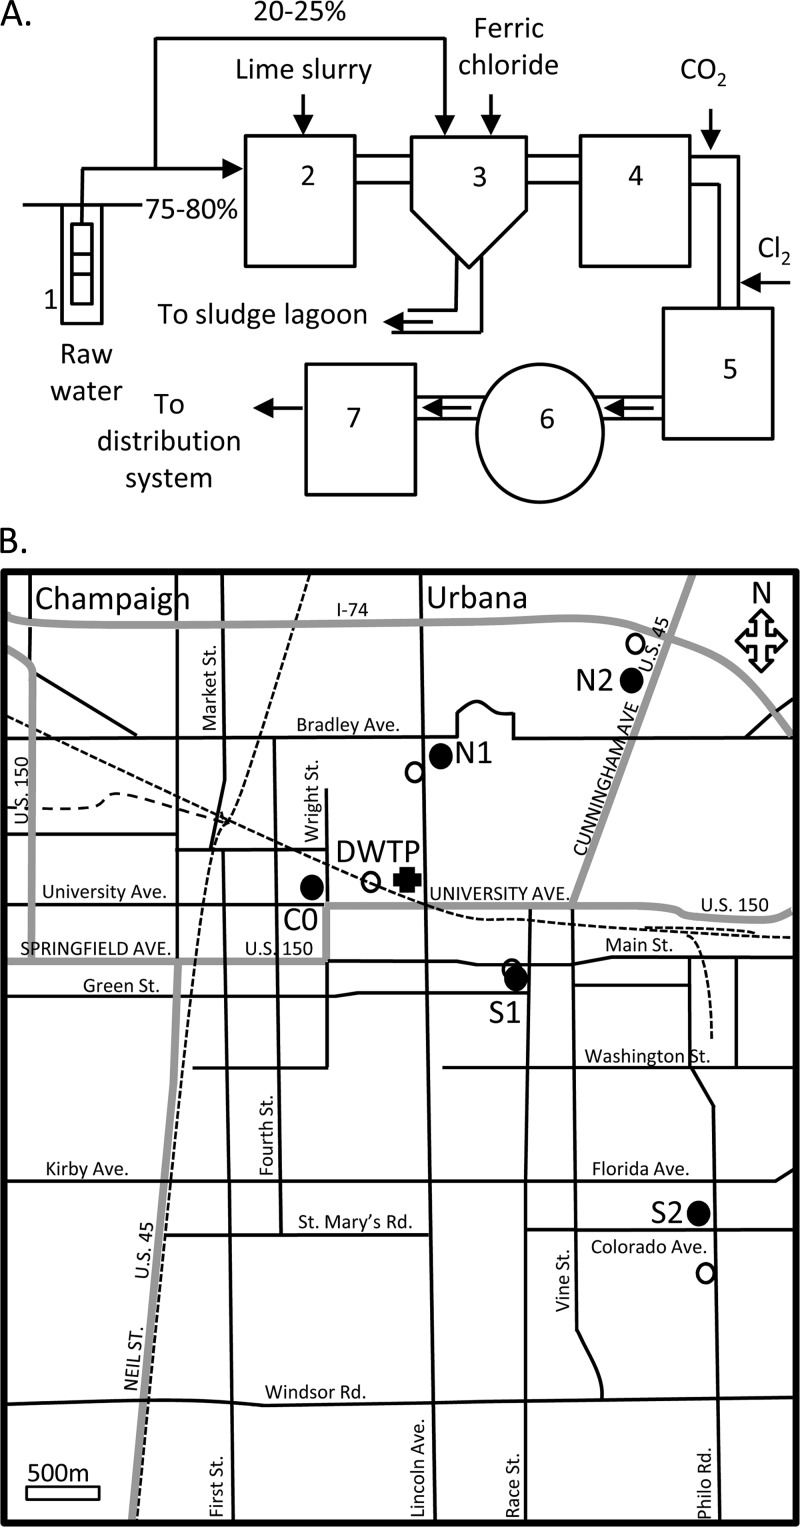
Fig 1.
(A) Schematic diagram of the drinking water treatment process at the water utility in Urbana, IL. Numbered sites: 1, water well; 2, primary basin; 3, mixing basin; 4, secondary basin; 5, filter unit; 6, clarifier; 7, clear well. (B) Map of the five water sampling sites for the present study (closed circles) and the closest sites for water chemistry measurements conducted by the water utility (open circles). The sites are labeled according to their relative position to the water utility (DWTP, cross symbol): one in the center (C0, immediate from the water treatment plant), two in the north (N1 and N2) and two in the south (S1 and S2). Water from S1 is collected for our study and the water utility.

