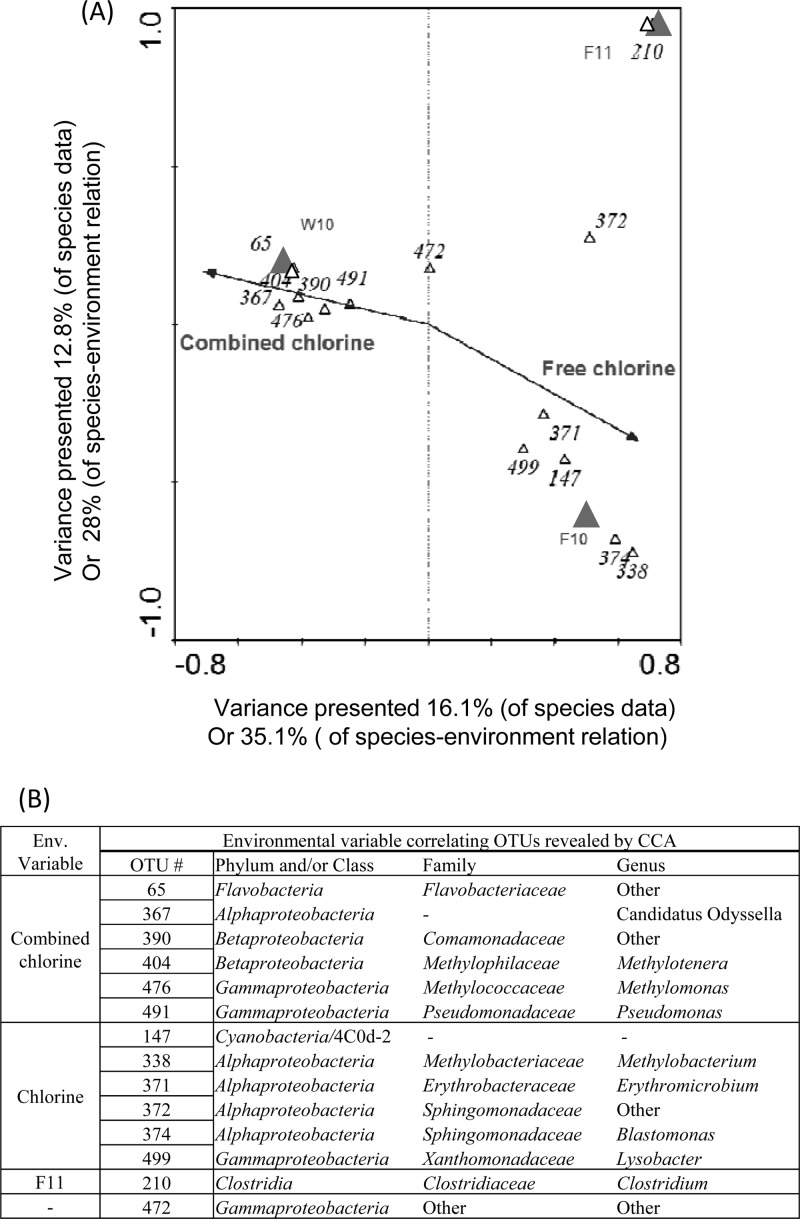
Fig 6.
(A) Ordination plots were provided to interpret sample-environment correspondence and species-environment correspondence. OTUs with weight > 5% were shown on the species-environment plots. (B) Abundant OTUs (weight > 5%) correlated with free or combined chlorine disinfection and their phylogenetic affiliation.

