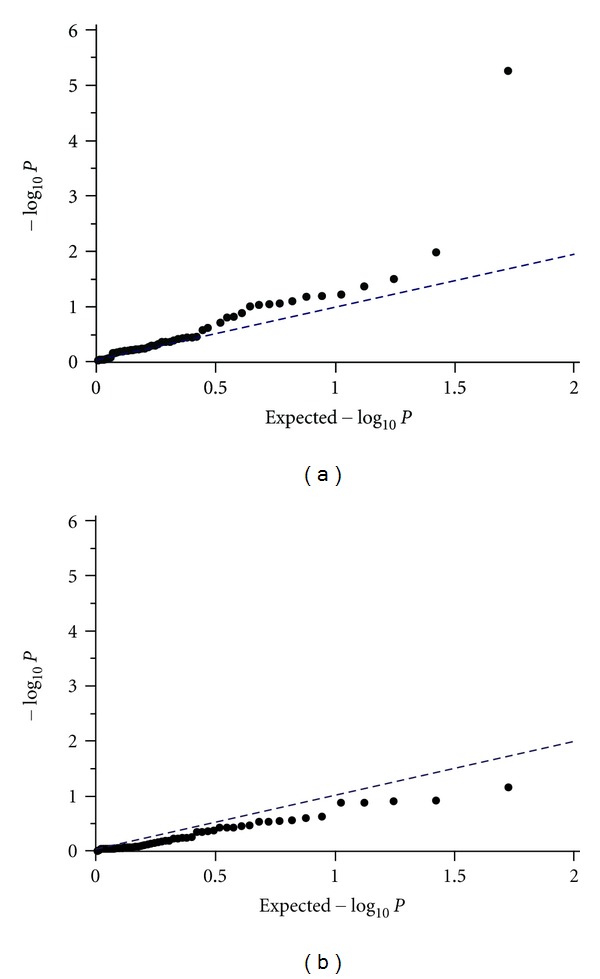
Figure 2.

Quantile-quantile plot for expected and observed −log10 P values. Distributions of P values illustrate little evidence of an overall systematic bias. CYP17A1 rs1004467 showed an excess of low P values possibly from true associations in subjects without antihypertensive medication (a). This excess was not evident in subjects receiving antihypertensive medication (b).
