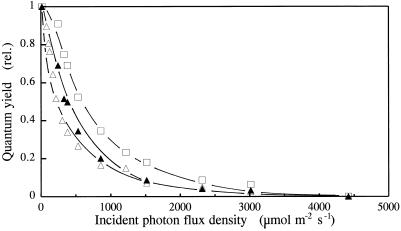
Figure 3.
Plots of the photoacoustically monitored Φ in barley leaves grown under different PSII excitation pressures induced by different light and gas environments versus the PFD of the incident light. ▵, Air and 400 μmol photons m−2 s−1; □, air and 1500 μmol photons m−2 s−1; ▵, 70 μg mL−1 CO2 and 10% O2 at 750 μmol photons m−2 s−1. Plants were grown for 8 d in the different light and gas environments.

