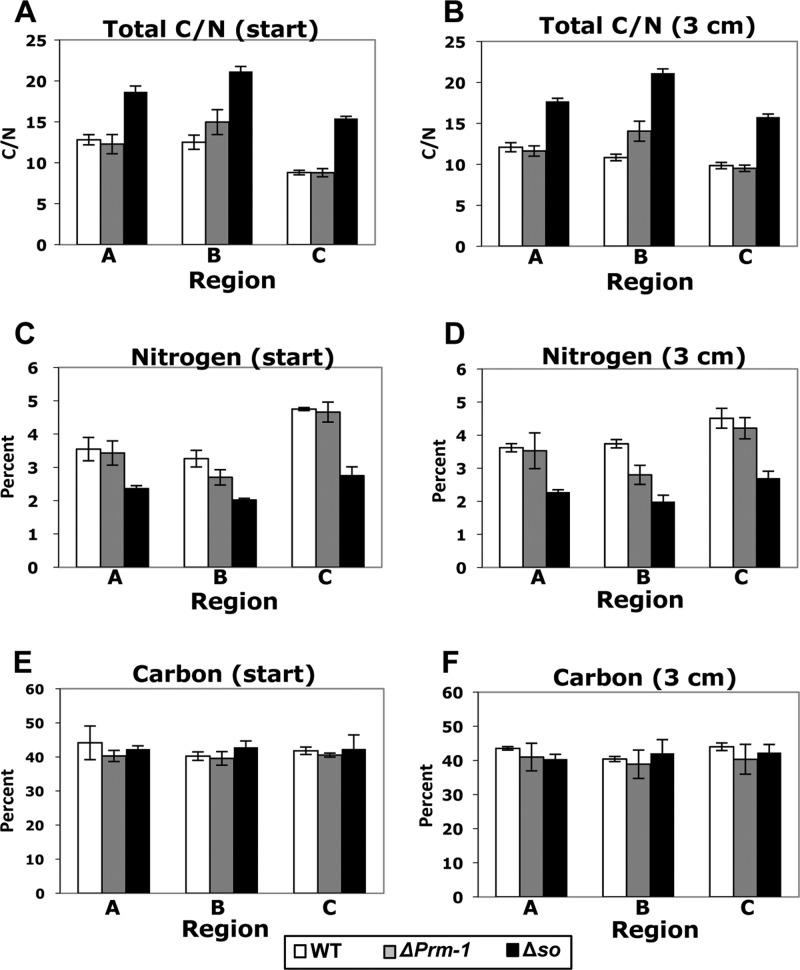
Fig 2.
Total C/N ratios found in different regions of WT and mutant N. crassa colonies. (A and B) Total carbon/nitrogen ratios obtained from regions A, B, and C (Fig. 1A) from the WT, ΔPrm-1, and Δso colonies when [15N]AIB tracer was added to the inoculation strip at the time of inoculation (start) (A) or after 3 cm of linear growth (B); (C and D) total percentages of nitrogen found in regions A, B, and C in the WT, ΔPrm-1, and Δso colonies when [15N]AIB tracer was added to the inoculation strip at the time of inoculation (start) (C) or after 3 cm of linear growth (D); (E and F) total percentages of carbon found in regions A, B, and C in the WT, ΔPrm-1, and Δso colonies when [15N]AIB tracer was added at inoculation (E) or after 3 cm of linear growth (F). Error bars indicate the standard errors. The average natural abundance of 15N for the unenriched control colonies was ∼4.5‰.

