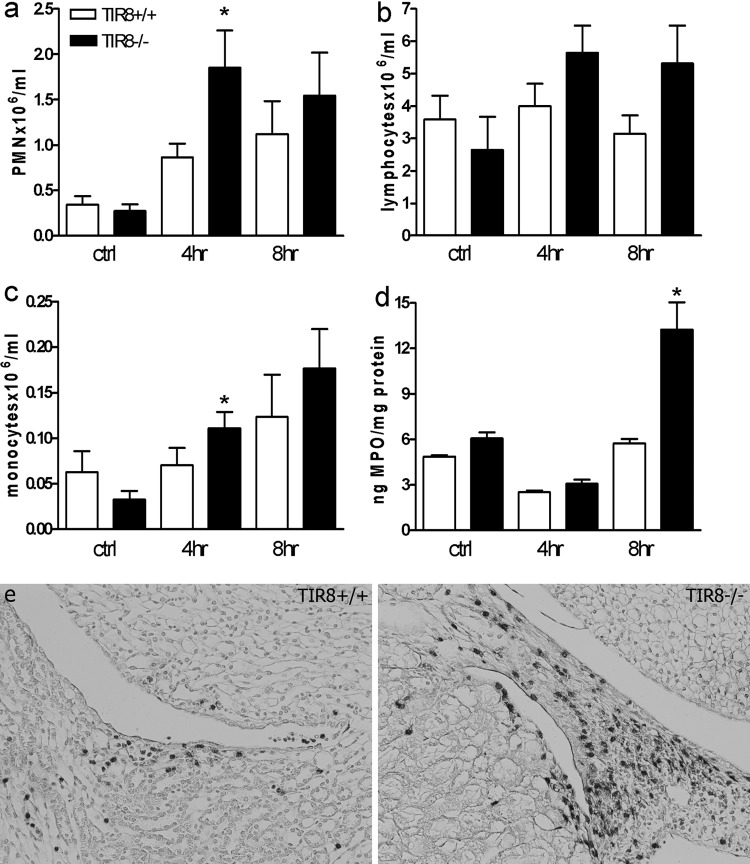
Fig 4.
Leukocyte dynamics in response to infection: neutrophil (a), lymphocyte (b), and monocyte (c) cell counts in blood, renal MPO levels (d), and neutrophil influx in the renal pyelum region (e) after transurethral bacterial challenge in TIR8+/+ and TIR8−/− mice. Data in panels a to d represent means ± SEM of 6 to 8 mice per group. *, P < 0.05.

