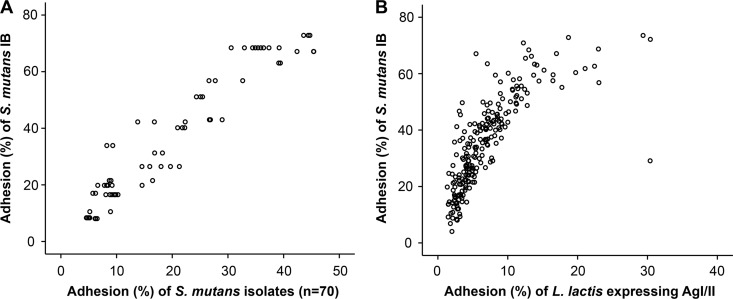
Fig 5.
(A) Scattergram of the adhesion of S. mutans Ingbritt (IB) (y axis) and of the isolates (n = 70) (x axis) to parotid saliva from strains donors (n = 19) (r = 0.929). Adhesion (%) indicates the percentage of adhering cells of the total number of cells added. (B) Scattergram of the adhesion of S. mutans Ingbritt (y axis) and of L. lactis MG1363 recombinantly expressing AgI/II (x axis) to saliva samples from multiple subjects (n = 218) (r = 0.86).

