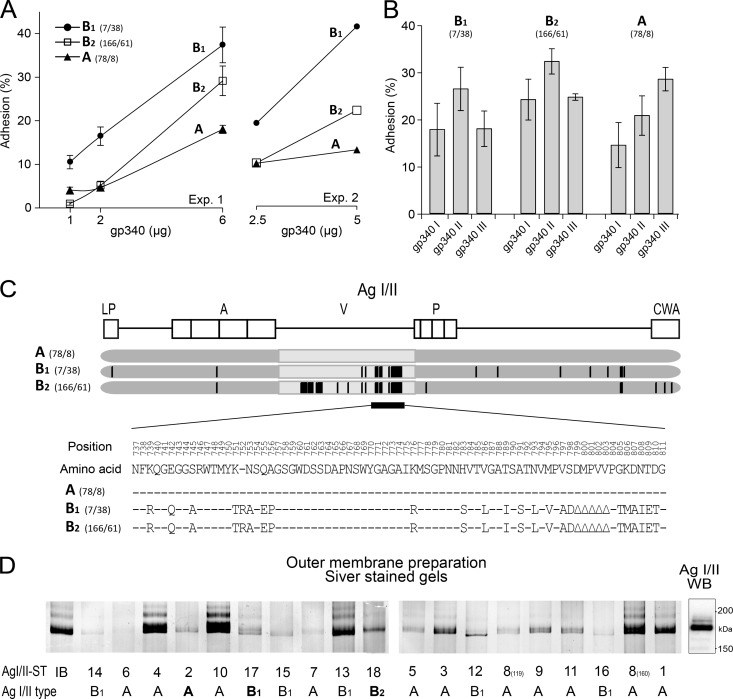
Fig 8.
S. mutans AgI/II types with different profiles of adhesion to saliva gp340 phenotypes I to III. (A) Adhesion of S. mutans AgI/II types to various amounts of gp340 in two separate experimental runs. Adhesion (%) indicates the percentage of adhering cells of the total number of cells added. (B) Adhesion of the S. mutans AgI/II types to saliva phenotypes with gp340 size variants I, II, and III. Adhesion (%) indicates the percentage of adhering cells of the total number of cells added. Shown are mean adhesion values and 95% CIs. (C) Schematic illustration of the structural variations of the AgI/II types. (D) AgI/II protein pattern for the independent isolates (n = 19) shown by silver staining of outer membrane surface extracts after electrophoresis on 5% gels. The AgI/II sequence types (STs 1 to 18) and AgI/II types A, B1, and B2 are marked. A Western blot (WB) with anti-AgI/II antibodies marks the reported position of the AgI/II protein band (18).

