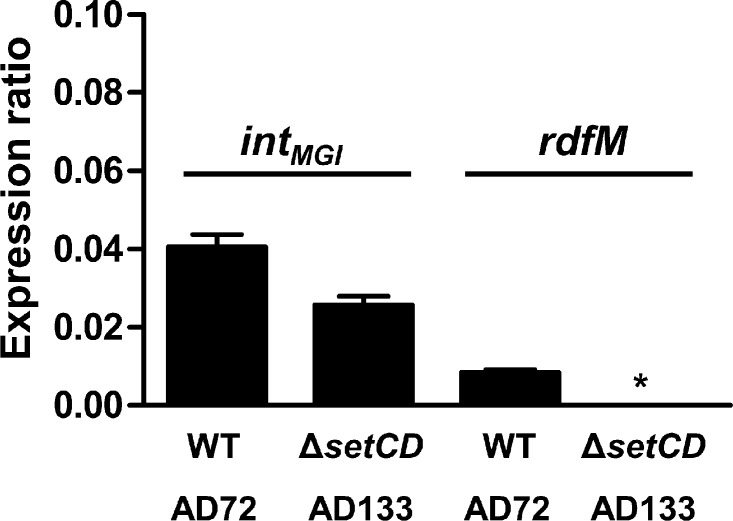
Fig 6.
intMGI has a basal level of expression in the absence of SetCD. The expression of intMGI was measured by quantitative PCR in AD72 and AD133. The graph shows differential gene expression values (ΔCT) compared with that of the housekeeping gene rpoZ. Results are expressed as the means of three independent biological replicates. The asterisk indicates that expression was below the detection limit. WT, wild type.

